The dashboard
See how many reports came in, how fast they were fixed, and which problems and departments are busiest.
The Dashboard shows how reports are going. Days follow your city's time zone.
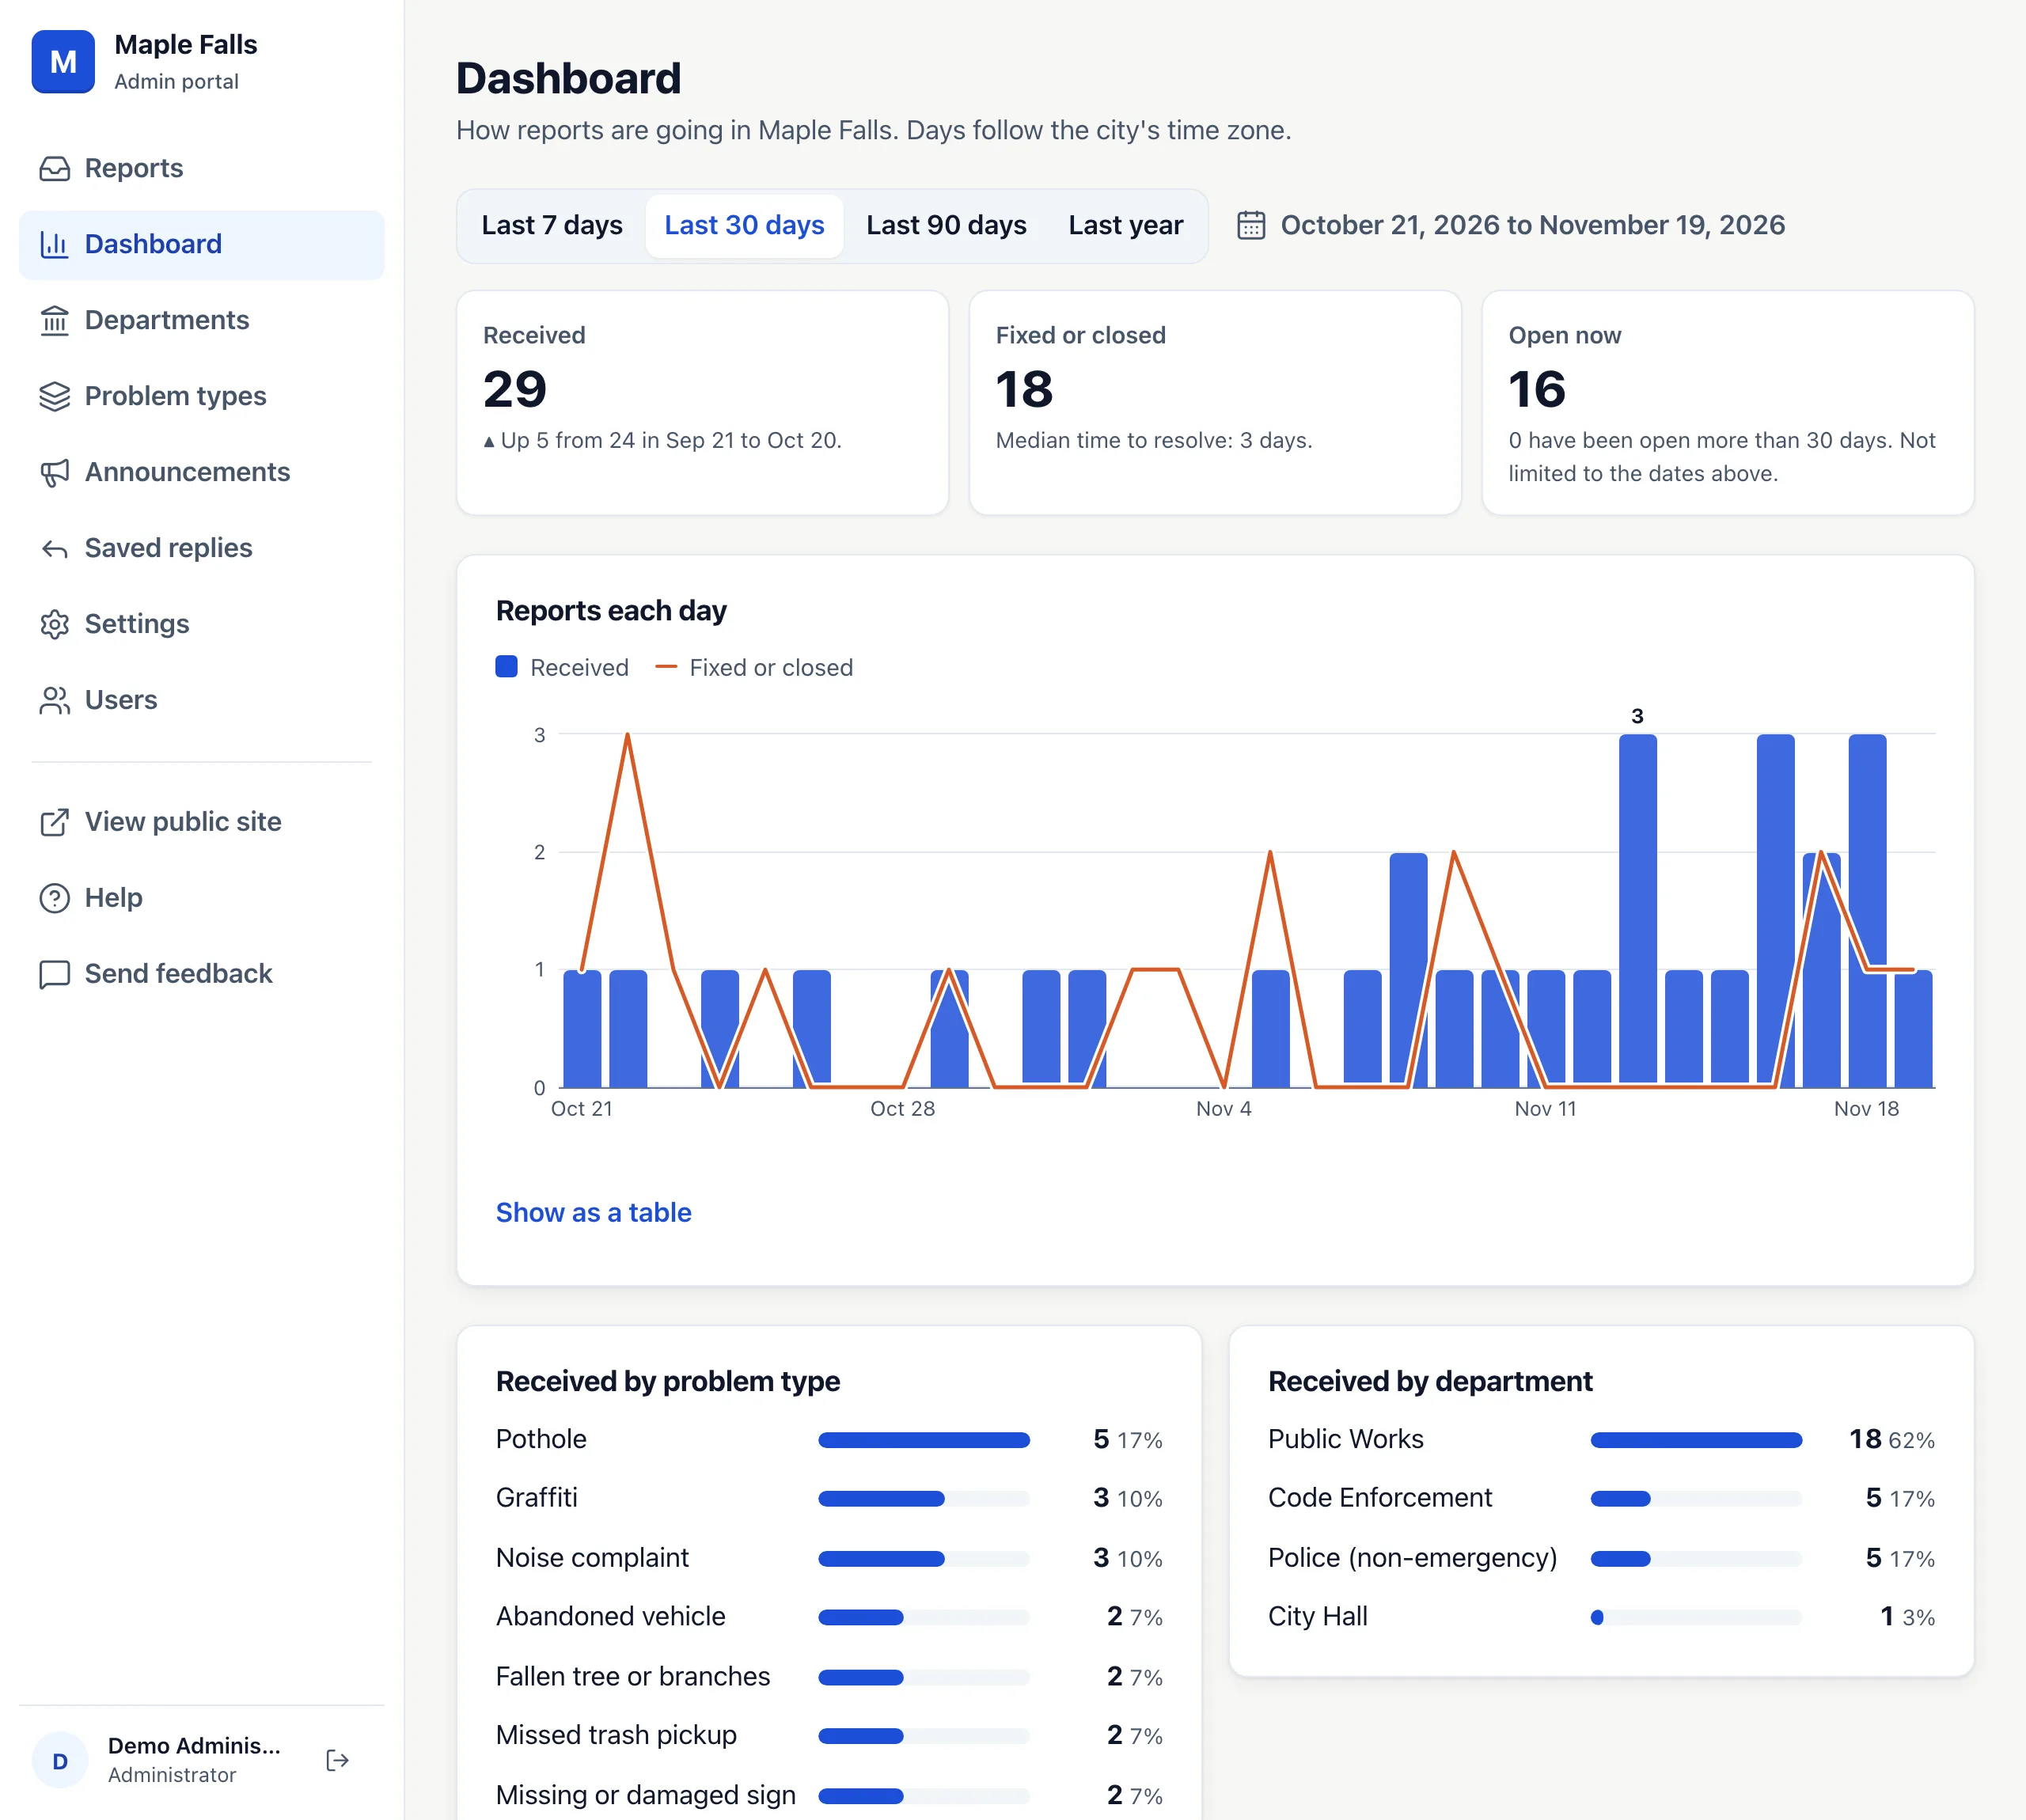
- Choose Last 7 days, Last 30 days, Last 90 days or Last year. The chart counts by day for 7 and 30 days, and by week for longer.
- Received compares the count with the same number of days before.
- Fixed or closed shows the median time to resolve: half the reports were fixed faster than this.
- Open now counts every open report, whatever its date, and how many have been open more than 30 days.
- The chart shows reports received as columns and reports fixed or closed as a line. Press Show as a table for the numbers.
- Received by problem type and Received by department show where reports come from.
Staff limited to one department see only their department's numbers.